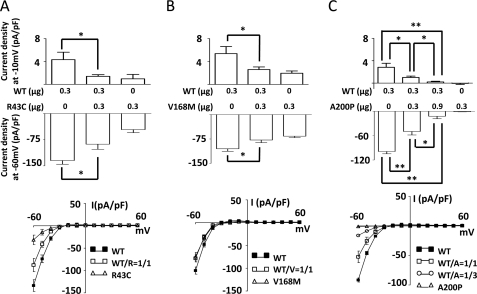
FIGURE 5.
Dominant negative effects of mutant Kir2.6 on wild type Kir2.6. A, B, and C, shown is the dominant negative effect of three individual mutations on wild type Kir2.6 current. WT and mutant pEGFP-Kir2.6 cDNAs (in μg as indicated) were cotransfected into HEK cells to test the dominant negative effect of R43C (A), V168M (B), and A200P (C) on WT Kir2.6 current. Upper, the bar graph shows whole-cell outward (at membrane potential −10 mV) and inward current density (at membrane potential −60 mV) for wild type Kir2.6 and/or mutant Kir2.6 channels (mean ± S.E., n ≥ 6 for each). Lower figures display current-voltage (I-V) relationship curves for each group (mean ± S.E., n ≥ 6 for each). WT/R, WT/V, and WT/A denote the expressed protein ratio of wild type versus R43C, V168M, or A200P mutants, respectively (for example, WT/A = 1/3 indicates the ratio of wild type Kir2.6 channel versus A200P Kir2.6 channel is 1:3). Single and double asterisks denote p < 0.05 and p < 0.01 respectively between indicated groups.

