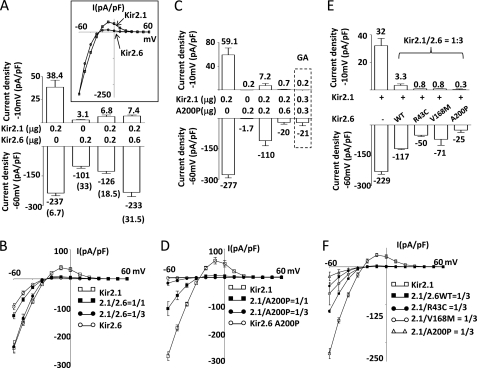
FIGURE 6.
Formation of functional heteromultimers between Kir2.1 and Kir2.6 and disease mutant Kir2.6 exerts dominant negative inhibition on Kir2.1. A and B, currents and I-V relationships of homomeric and heteromeric Kir2.1 and Kir2.6 channels are shown. C, dose-dependent dominant negative effect of A200P Kir2.6 mutant on Kir2.1 is shown. E, the dominant negative effect of disease mutant Kir2.6 on Kir2.1 is shown. Kir2.1 and either wild type Kir 2.6 (A) or A200P Kir2.6 (C) (in μg of cDNA as indicated) were cotransfected in HEK cells. In E, the cDNA ratio of Kir2.1 versus either WT or disease mutant (R43C, V168M, A200P) Kir2.6 are all 1/3 (Kir2.1, 0.15 μg; Kir2.6, 0.45 μg). Upper and lower bar figures represent outward current densities at a pipette holding potential of −10 mV and inward current densities at a pipette holding potential −60 mV, respectively (mean ± S.E., n ≥ 6 for each group). Numbers above or below each bar represent the mean current for each group. Numbers in parentheses in A indicate the absolute value of the ratio between inward current at −60 mV and outward current at −10 mV for each group. The inset in A shows the overlap of normalized current voltage (I-V) relationships curves of Kir 2.1 and wild type Kir2.6. The dotted box in C represents a separate experiment with Kir2.1 and G145A (GA) Kir2.6 cotransfected in HEK cells. B, D, and F, shown are current voltage (I-V) relationships curves of each group in A, C, and E, respectively. 2.1/2.6WT and 2.1/A200P, 2.1/R43C, or 2.1/V168M denote the cDNA ratio (for example, 2.1/2.6 = 1/1 indicates that the same amounts of Kir2.1 and wild type Kir2.6 cDNA were cotransfected), respectively.

