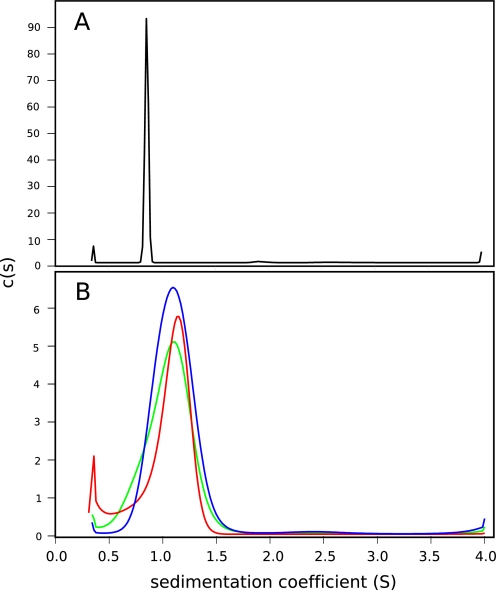
FIGURE 4.
Sedimentation velocity analytical ultracentrifugation. c(s) distributions for (A) 228 μM LZ0 (B) LZ5 (blue) and LZ5 K309C/C335A at a concentration of 224 μM in reducing (red) and non-reducing conditions (green). LZ5 wt is shown in blue, LZ5 K309C/C335A in reducing buffer in red and in non-reducing buffer in green. For details on the data analysis see “Experimental Procedures.” For full results see Table 1.

