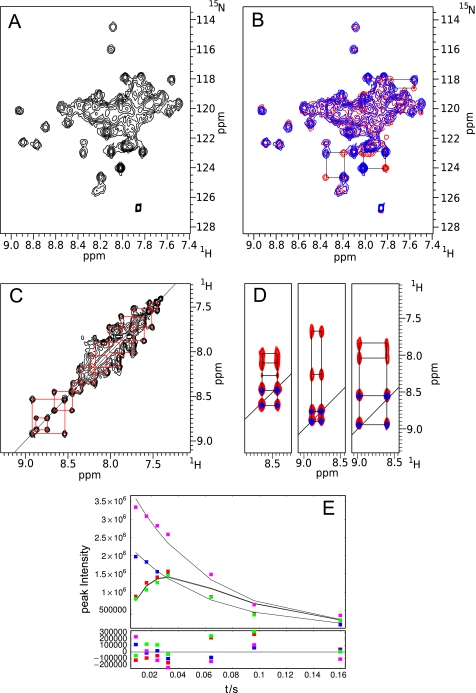
FIGURE 5.
NMR spectra of LZ5. A, HSQC spectrum at T = 278K, 600 MHz. B, 15N exchange experiment shown as HSQC (red), mixing time 60 ms, superimposed on HSQC (blue). Connections of exchanging species in the HSQC spectrum via the cross peaks in the exchange spectrum are shown by black boxes for a few residues. C, 15N exchange experiment shown as NOESY, mixing time 60 ms. The exchange for a number of residues is illustrated by red squares. D, superposition of 1H-1H slices of the three-dimensional 15N exchange experiment (64 ms mixing time) with a 15N NOESY-HSQC (100 ms mixing time). Contours for the NOESY are in red, contours for the exchange experiment in blue. E, time dependence of exchange (red, green) and diagonal peak (blue, magenta) intensity of a selected residue (boxes) compared with the results of the fits (continuous lines). Fitting errors are shown below.

