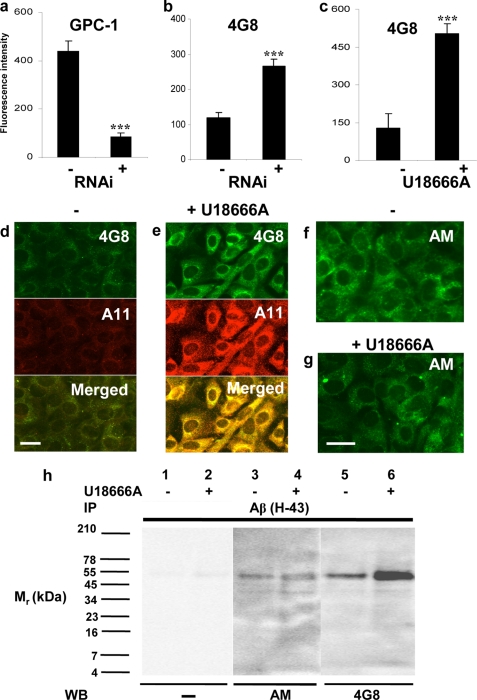
FIGURE 5.
Effect of silencing Gpc-1 expression or treatment with U18666A on Aβ, A11, and anMan immunoreactivity in Tg2576 fibroblasts. The flow cytometry measurements (a–c) were obtained after staining mock- (−) or Gpc-1 RNAi-transfected (+) Tg2576 fibroblasts (a and b) for Gpc-1 using a polyclonal antibody (a) or Aβ using mAb 4G8 (b) and after staining untreated (−) or U18666A-treated (+) cells for Aβ using mAb 4G8 (c). The error bars indicate S.E.; ***, p < 0.001. The results of RNAi transfection were scored after 48 h of cell growth. The immunofluorescence microscopy images (d–g) were obtained after staining cultures of untreated (−) or U18666A-treated (+) Tg2576 fibroblasts for Aβ using mAb 4G8 (green) and the polyclonal antibody A11 (red), respectively (d and e), and for anMan-containing HS degradation products using mAb AM (green) (f and g). Scale bar, 20 μm. In h, SDS-PAGE was performed on Aβ (H-43) immunoisolates (IP) derived from untreated (−) or U18666A-treated (+) confluent Tg2576 fibroblast cultures followed by Western blotting (WB) with the anMan-specific mAb (AM) or the Aβ-specific mAb (4G8). Band intensities were estimated by densitometry. Treatment with 10 μg/ml U18666A was carried out for 16 h. These experiments were repeated twice.

