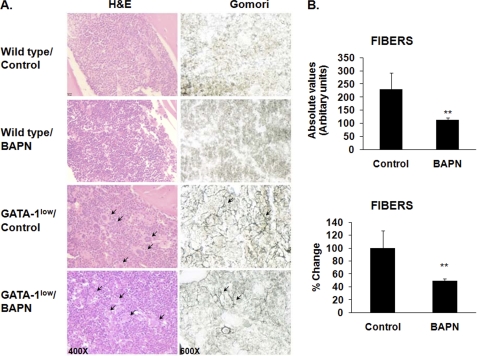
FIGURE 8.
Effect of LOX inhibition on marrow fibrosis in vivo. A, representative hematoxylin & eosin (H&E, left column) and Gomori silver (right column) staining of longitudinal sections of femurs from wild-type and GATA-1low (male littermates), control, or BAPN-treated mice (10.5 weeks old at the time of collection), as described under “Experimental Procedures.” Original magnification for the left column was 400× and for the right column are 600×. Arrows indicate the large presence of MKs (H&E stain) and the accumulation of reticulin fibers (Gomori) in the GATA-1low mice. As expected, no such fibers were detected in wild-type mice. Counting morphologically recognizable MKs in eight sections per mouse, using histological approaches described earlier (37–39), showed no significant differences in MK number in bone marrow sections of control and BAPN-treated mice. Similar results were obtained in a total of five mice per group. MK counting was further confirmed by flow cytometry analysis as in Fig. 3 (data not shown). B, quantification of fibrosis in BAPN- or vehicle-treated GATA-1low mice. Fibers were measured in arbitrary units (as described under “Experimental Procedures”) from stained sections. Data are represented as absolute values (top panel) or as mean percent change compared with values recorded from vehicle-treated GATA-1low mice (bottom panel). The mean values were obtained from five mice per group. Scale bars (10 μm) are at the upper left corner of each column. Results are presented as absolute values and percentage change; n = 5; *, p < 0.05.

