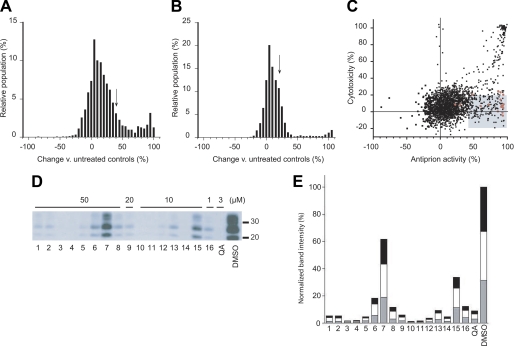
FIGURE 1.
Identification of compounds from the Microsource library with antiprion activity. A, the distribution of induced changes in PrPSc levels in ScN2a cells following 5 days of treatment with 1 μm of each compound. PrPSc levels were measured by ELISA following PK digestion, then quantified relative to untreated control cells. Compounds resulting in ≥40% PrPSc decrease (arrow) were considered hits for antiprion activity. B, the distribution of cytotoxic effects of compounds measured by the calcein AM assay. Compounds decreasing cell viability by ≤20% (arrow) were considered nontoxic hits. C, the hit set (n = 206, shaded box) that fulfilled antiprion activity and cytotoxicity criteria. Red dots correspond to compounds with antiprion activities previously identified by Kocisko et al. (26). D, secondary validation of the antiprion activity for a subset of hits. Compounds were added to ScN2a cells at the indicated concentrations for 5 days, and the resulting PK-resistant PrPSc levels were analyzed by Western blotting using conjugated D13-HRP antibody to detect PrP. Lane numbers (bottom) correspond to compound ID indicated in Table 1. Quinacrine (QA) and DMSO alone were analyzed as positive and negative controls, respectively. Apparent molecular mass markers are indicated in kilodaltons. E, quantification of PrPSc band intensities relative to untreated controls. The gray, white, and black bars indicate the relative intensities of the unglycosylated, monoglycosylated, and diglycosylated bands, respectively.

