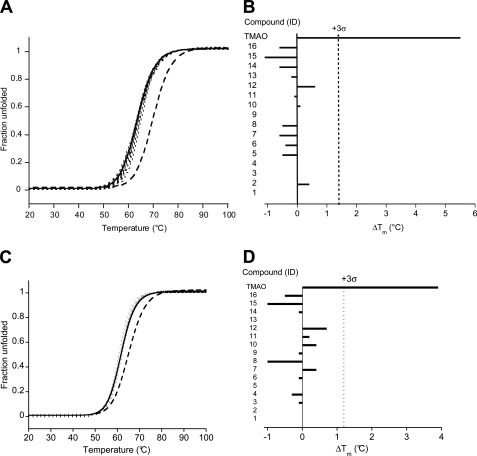
FIGURE 3.
Effect of the 16 validated antiprion compounds on the stability of recombinant PrP measured by CD. A and C, thermal denaturation curves (λ = 230 nm) of PrP(89–230) (A) and PrP(23–230) (C) alone (solid lines), in the presence of 1 m TMAO (dashed line), or in the presence of the 16 validated antiprion compounds at 100 μm (dotted lines). B and D, comparison of ΔTm for the 16 validated compounds and the 1 m TMAO control. The dotted line indicates the 3 σ boundary for statistical significance.

