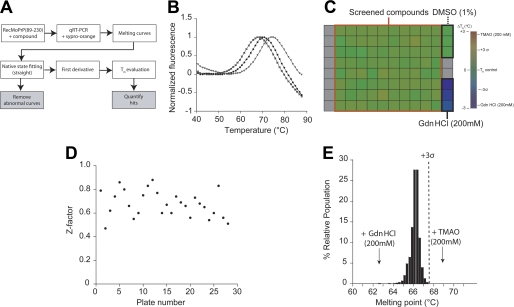
FIGURE 4.
Screening the interaction of the Microsource library with recombinant PrP using DSF. A, the DSF assay strategy; see “Experimental Procedures” for detailed descriptions. B, normalized melting curves of recombinant PrP obtained alone (black circles), with 200 mm TMAO (triangles), or with 200 mm GdnHCl (squares). C, a representative assay plate. The indicated color scale represents the range of Tm values. Gray squares signify empty wells. D, Z-factor measurements plotted for each experimental plate. E, the distribution of Tm values for PrP, after exposure to 100 μm of each compound, is plotted as a percentage of the relative population. The arrows indicate the median value for all GdnHCl and TMAO control measurements. The dotted line indicates the 3 σ boundary for statistical significance.

