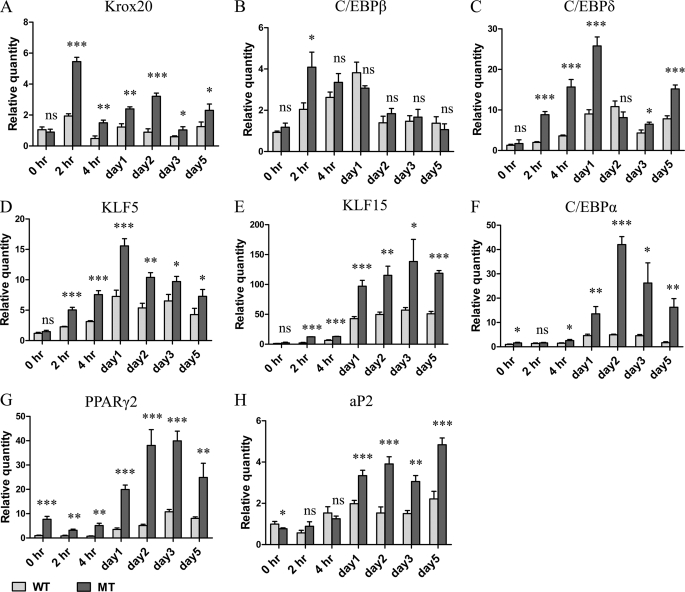
FIGURE 4.
Real-time PCR analysis of adipogenesis regulators during differentiation induction. MEFs 8 days after confluence were treated with standard differentiation medium, IDMT for 3 days followed by regular DMEM for another 2 days. At the indicated time points cells were collected for RNA isolation and subjected to real-time PCR analysis. Bars represent the mean ± S.D. (error bars) of relative amount of mRNA expression normalized to β-actin. *, p < 0.05 significant statistical difference; **, p < 0.01 significant statistical difference; ***, p < 0.001 significant statistical difference; ns, no significant statistical difference at p < 0.05. Data are representative of at least two independent experiments.

