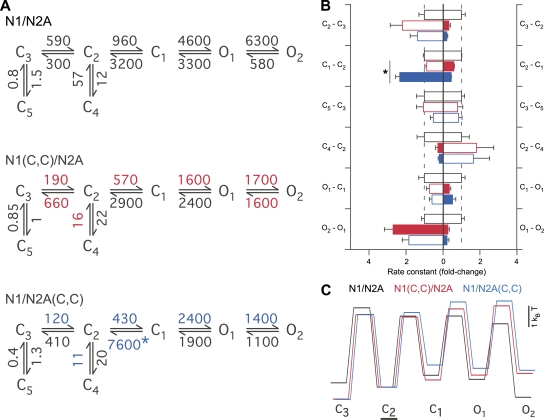
Figure 7.
Effects of the intrasubunit GluN1 or GluN2A cross-links on the kinetic mechanism of NMDA receptor activation. (A) Sequential-state model (Kussius and Popescu, 2009) of NMDA receptor activation with the rate constants (s−1) of transitions averaged from fits of individual single-channel recordings. Significant differences (P < 0.05) relative to WT are indicated with colored rate constants. Significant differences (P < 0.05) between GluN1(C,C)/GluN2A and GluN1/GluN2A(C,C) are indicated with asterisks. (B) Mean fold change (±SEM) in rate constants relative to GluN1/GluN2A. The left and right axes show the reverse and forward rate constants, respectively. Significant differences (P < 0.05) relative to WT and between GluN1(C,C)/GluN2A and GluN1/GluN2A(C,C) are indicated with filled bars and asterisks, respectively. (C) Free energy landscape plotted with respect to C2. The off-pathway steps to and from C4 and C5 are excluded. The three traces are horizontally offset for clarity.

