Figure 3.
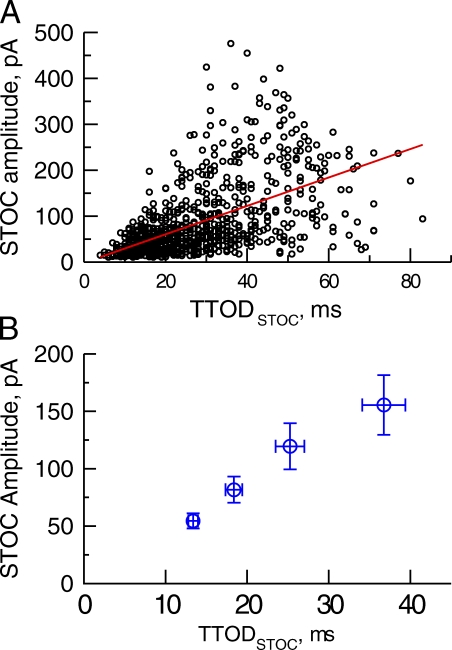
STOC amplitude is correlated with TTODSTOC. STOCs are from the data shown in Fig. 2 C. (A) The relationship between TTODSTOC and STOC amplitude (r = 0.5720, P < 0.0001, n = 954 events). (B) Quartile analysis of TTODSTOC and STOC amplitude (n = 8 cells).

