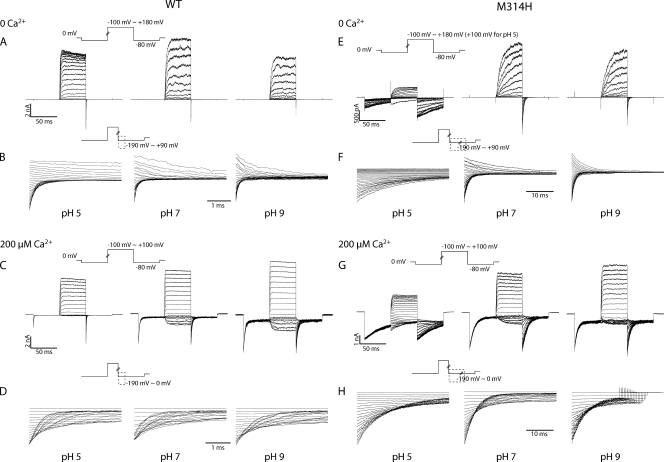
Figure 2.
(A–D) Current traces in response to activation and deactivation voltage protocols for WT BK channels. (A) Current traces in response to activation voltage protocols with 0 Ca2+ in pH 5 (left), pH 7 (middle), and pH 9 (right). The patch was held at 0 mV, stepped down to −80 mV for 50 ms, stepped to voltages of −100 to +180 mV for 50 ms with 10-mV increments between sweeps, and then to −80 mV for 50 ms, and back to 0 mV. (B) Current traces in response to deactivation voltage protocols with 0 Ca2+ in pH 5 (left), pH 7 (middle), and pH 9 (right). The patch was held at 0 mV, stepped to +180 mV to activate the channels, and then down to voltage levels of −190 to +90 mV to deactivate the channels, with 10-mV increments between sweeps. Current traces of the first 3.5 ms of the deactivation period were shown (200 µs immediately after the voltage command was omitted, same for the other figures). (C) Current traces in response to activation voltage protocols with 200 µM Ca2+ in pH 5 (left), pH 7 (middle), and pH 9 (right). The patch was held at 0 mV, stepped down to −80 mV for 50 ms, stepped to voltages of −100 to +100 mV for 50 ms with 10-mV increments between sweeps, and then to −80 mV for 50 ms, and back to 0 mV. (D) Current traces in response to deactivation voltage protocols with 200 µM Ca2+ in pH 5 (left), pH 7 (middle), and pH 9 (right). The patch was held at 0 mV, stepped to +100 mV to activate the channels, and then down to voltage levels of −190 to 0 mV to deactivate the channels, with 10-mV increments between sweeps. Current traces of the first 3.5 ms of the deactivation period were shown. (E–H) Current traces in response to activation and deactivation voltage protocols for M314H BK channels. (E) Current traces in response to activation voltage protocols with 0 Ca2+ in pH 5 (left), pH 7 (middle), and pH 9 (right). The patch was held at 0 mV, stepped down to −80 mV for 50 ms, stepped to voltages of −100 to +180 mV for 50 ms with 10-mV increments between sweeps, and then to −80 mV for 50 ms, and back to 0 mV. (F) Current traces in response to deactivation voltage protocols with 0 Ca2+ in pH 5 (left), pH 7 (middle), and pH 9 (right). The patch was held at 0 mV, stepped to +180 mV to activate the channels, and then down to voltage levels of −190 to +90 mV to deactivate the channels, with 10-mV increments between sweeps. Current traces of the first 35 ms of the deactivation period were shown. (G) Current traces in response to activation voltage protocols with 200 µM Ca2+ in pH 5 (left), pH 7 (middle), and pH 9 (right). The patch was held at 0 mV, stepped down to −80 mV for 50 ms, stepped to voltages of −100 to +100 mV for 50 ms with 10-mV increments between sweeps, and then to −80 mV for 50 ms, and back to 0 mV. (H) Current traces in response to deactivation voltage protocols with 200 µM Ca2+ in pH 5 (left), pH 7 (middle), and pH 9 (right). The patch was held at 0 mV, stepped to +100 mV to activate the channels, and then down to voltage levels of −190 to 0 mV to deactivate the channels, with 10-mV increments between sweeps. Current traces of the first 35 ms of the deactivation period are shown.

