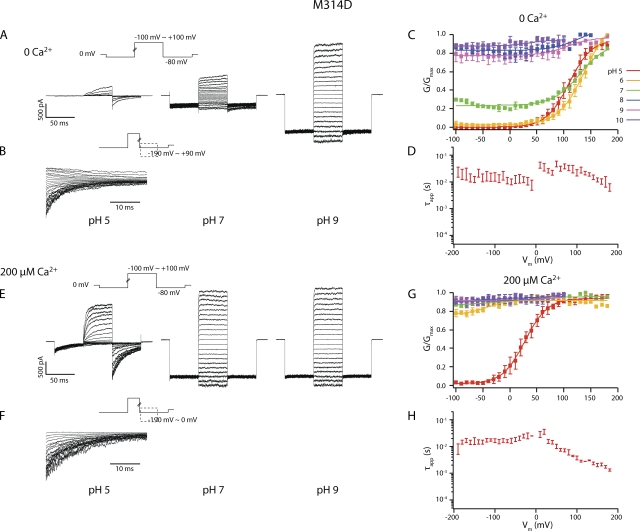
Figure 6.
(A) Current traces in response to activation voltage protocols for M314D in 0 Ca2+ in pH 5, pH 7, and pH 9. The patch was held at 0 mV, stepped down to −80 mV for 50 ms, stepped to voltages of −100 to +100 mV for 50 ms with 10-mV increments between sweeps, and then to −80 mV for 50 ms, and back to 0 mV. (B) Current traces in response to deactivation voltage protocols for M314D in 0 Ca2+ in pH 5. The patch was held at 0 mV, stepped to +100 mV to activate the channels, and then down to voltage levels of −190 to +90 mV to deactivate the channels, with 10-mV increments between sweeps. Current traces of the first 35 ms of the deactivation period are shown. (C) pH-dependent G-V shifts in M314D BK channels in nominal 0 Ca2+. (D) τapp–V relations of M314D in pH 5 and 0 Ca2+. (E) Current traces in response to activation voltage protocols for M314D in 200 µM Ca2+ in pH 5, pH 7, and pH 9. The patch was held at 0 mV, stepped down to −80 mV for 50 ms, stepped to voltages of −100 to +100 mV for 50 ms with 10-mV increments between sweeps, and then to −80 mV for 50 ms, and back to 0 mV. (F) Current traces in response to deactivation voltage protocols for M314D in 200 µM Ca2+ and pH 5. The patch was held at 0 mV, stepped to +100 mV to activate the channels, and then down to voltage levels of −190 to 0 mV to deactivate the channels, with 10-mV increments between sweeps. Current traces of the first 35 ms of the deactivation period are shown. (G) pH-dependent G-V shifts in M314D BK channels in 200 µM Ca2+. (H) τapp–V relations of M314D in pH 5 and 200 µM Ca2+. Each point was calculated from a dataset with n ≥ 3.

