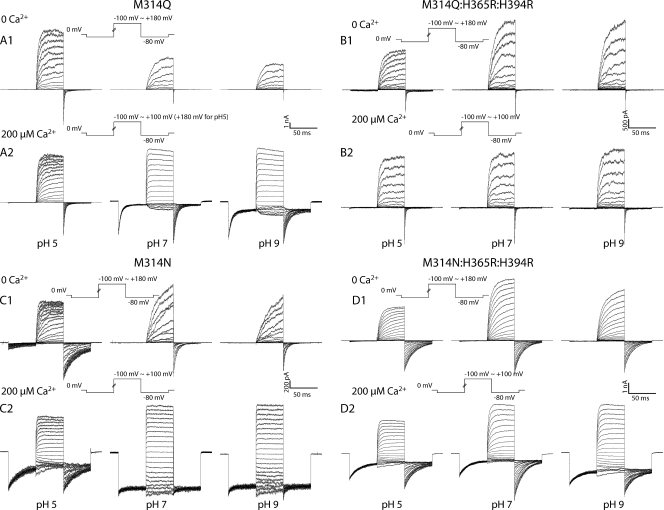
Figure 9.
(A) Current traces in response to activation voltage protocols for M314Q channels in 0 Ca2+ (1) and 200 µM Ca2+ (2) in pH 5.0 (left), pH 7 (middle), and pH 9 (right). (B) Current traces in response to activation voltage protocols for M314Q:H365R:H394R channels in 0 Ca2+ (1) and 200 µM Ca2+ (2) in pH 5.0 (left), pH 7 (middle), and pH 9 (right). (C) Current traces in response to activation voltage protocols for M314N channels in 0 Ca2+ (1) and 200 µM Ca2+ (2) in pH 5.0 (left), pH 7 (middle), and pH 9 (right). (D) Current traces in response to activation voltage protocols for M314N:H365R:H394R channels in 0 Ca2+ (1) and 200 µM Ca2+ (2) in pH 5.0 (left), pH 7 (middle), and pH 9 (right).

