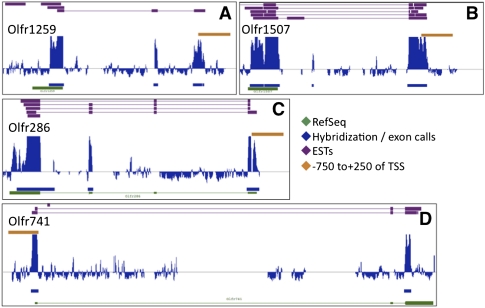
Figure 1.
One thousand eighty-five olfactory receptor 5′ structures mapped by high-throughput RLM-RACE. For selected ORs (A–D), RefSeq records (green), ESTs (purple), summary hybridization patterns and computed exons (blue), and promoter calls (orange) are displayed in IGB. Our hybridization patterns match RefSeq and EST records well. As shown for Olfr286, the tiling array cannot detect exons that occur in RepeatMasked (and therefore untiled) areas of the genome or across probes that do not map uniquely. For scale, the orange bar is 1000 bp in each panel.

