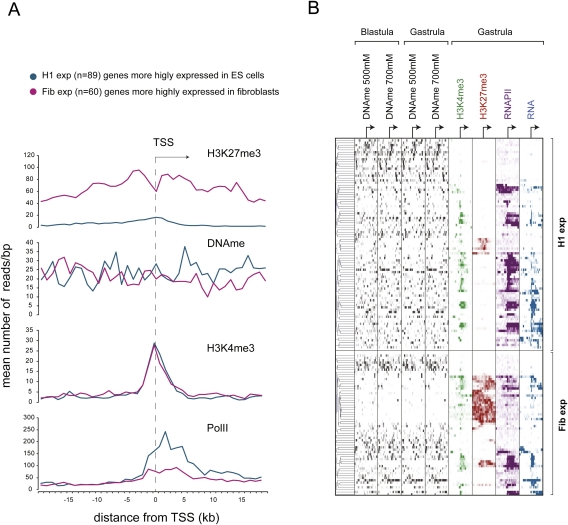
Figure 5.
Conserved patterns of epigenetic regulation in human ES cells and Xenopus embryos. (A) Distribution of RNAPII, H3K4me3, H3K27me3, and DNA methylation (average values of all four tracks) around TSSs corresponding to Xenopus orthologs of two gene groups differing in their expression status among fetal fibroblasts (Fib) and ES cells (H1). The genes with higher expression in ES cells (H1-exp) are also more highly expressed in Xenopus embryos and show increased DNA methylation both upstream of and downstream from the TSS. These orthologs also have a significantly higher DNA methylation in the region spanning 10 kb upstream of the TSS (P-value = 0.031, Wilcoxon rank test), the region 10 kb downstream from the TSS (P-value = 0.0026), and the total region from −10 kb to +10 kb relative to the TSS (P-value = 0.0023). (B) Hierarchical clustering performed on Xenopus orthologs of H1-exp and Fib-exp genes shows an inverse relationship between DNA methylation and H3K27me3. It also shows a high level of DNA methylation on promoters of robustly expressed H1-exp orthologs.

