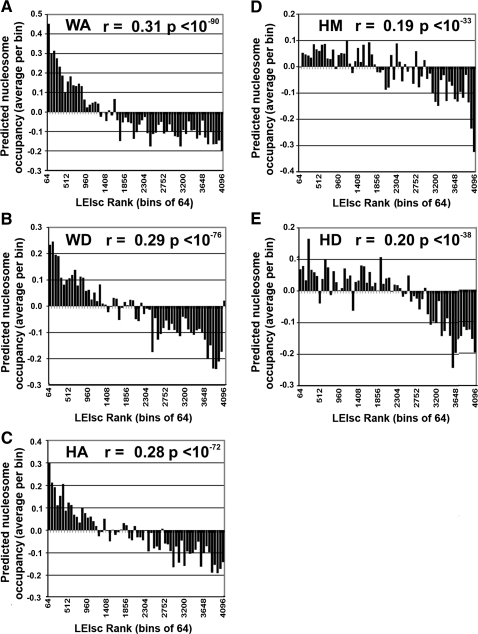
Figure 9.
LEIscs are positively correlated with their predicted nucleosome occupancy scores. The full set of 4096 6-mers were divided into 64 groups of 64 ranked by their LEIscs values at a particular location (the first group of 6-mers represents those with the highest LEIscs). Nucleosome positioning scores of 6-mers were extracted from the data as measured by sequencing 150-mers described by Kaplan et al. (2009) and found at http://genie.weizmann.ac.il/pubs/nucleosomes08/nucleosomes08_data.html. The average nucleosome occupancy score of the 64 6-mers in each set was used for each bin. Pearson's correlation coefficient and the P-value (F test) were calculated from the unbinned data and are shown for each indicated location. Note that a rank of 1 represents the highest LEIsc value.(A) WA location; (B) WD location; (C) HA location; (D) HM location; (E) HD location.

