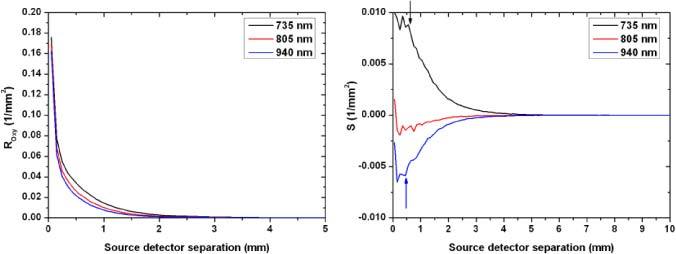
Fig. 5.

Left panel; Fluence decay curves for all three wavelengths as a function source to detector separation. These curves correspond to the case of oxygenated blood. The curves indicate a rapid decay in total collected fluence with increasing separation. Right panel: the difference (S = ROXY – RDEOXY) as a function of source to detector separation. The signal S shows a plateau phase with a maximal value followed by a rapid decay for the 735 and 940 nm wavelengths. The 805 nm wavelength carries a low oxygenation signal since it was slightly on the IR side of the isobestic point. The arrows indicate the end of the plateau phase and the start of the rapid decay.
