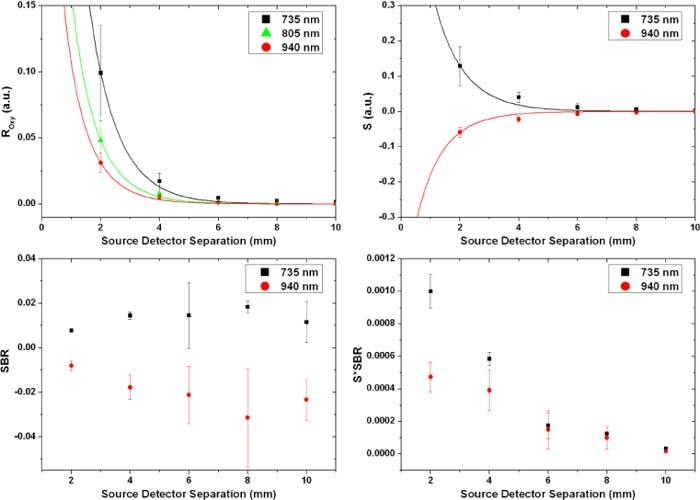
Fig. 10.

In vitro data collected from the PDMS based phantom perfused with the dye solutions. The solid lines show the data from the MC model while the squares and circles represent the average of the collected data from the phantom at the 735 and 940 nm wavelengths respectively. The error bars correspond to ± one standard deviation.
