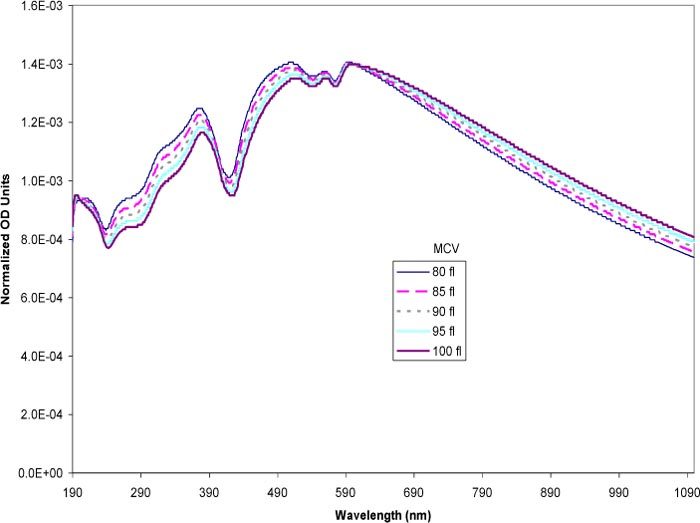
Fig. 4.

Simulated spectra of erythrocytes at varying MCV at constant high MCHC (0.33 mass fraction). The MCV was varied in the physiological range of 80–100 fl. The volumes were expressed in the model as the equivalent sphere diameter. The spectra were normalized to eliminate the effects of number based cell concentration.
