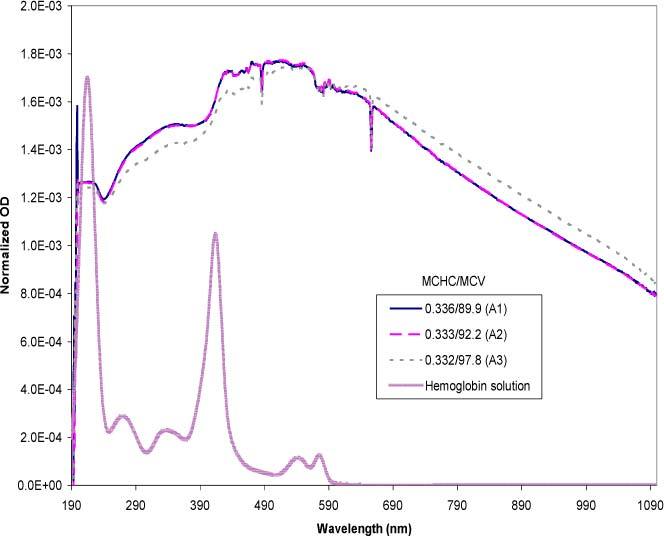
Fig. 10.

Experimental data set of purified red cells in the high MCHC range with varying MCV values. The data set is normalized in the 230-900 nm range using the area under the curve method. The MCHC is expressed in mass fractions and the MCV in fl. The free hemoglobin solution spectrum is included as a reference.
