
Fig. 11.
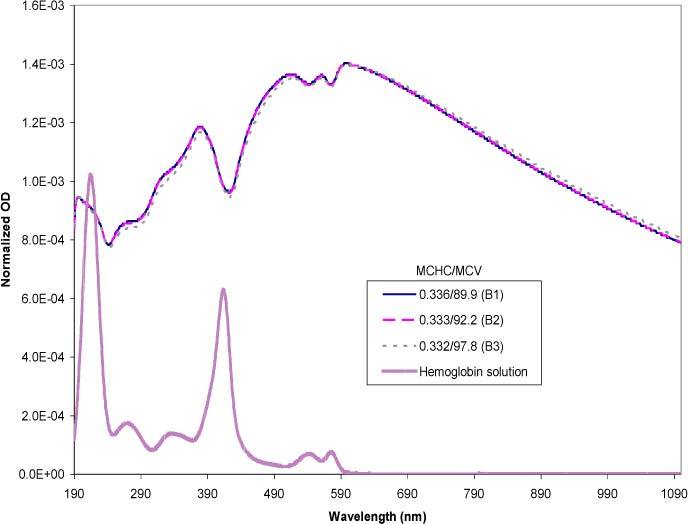
Simulated spectra mimicking the experimental data set from Fig. 6, normalized on a per cell basis. The MCHC is expressed in mass fractions and the MCV in fl. The free hemoglobin solution spectrum is included as a reference.
Official websites use .gov
A
.gov website belongs to an official
government organization in the United States.
Secure .gov websites use HTTPS
A lock (
) or https:// means you've safely
connected to the .gov website. Share sensitive
information only on official, secure websites.
Simulated spectra mimicking the experimental data set from Fig. 6, normalized on a per cell basis. The MCHC is expressed in mass fractions and the MCV in fl. The free hemoglobin solution spectrum is included as a reference.