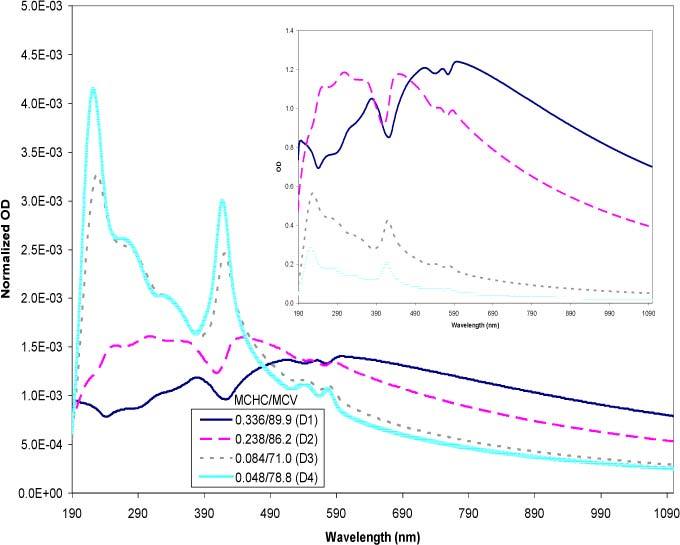
Fig. 13.

Simulated spectra of resealed cells using the experimental MCHC and MCV values in Fig. 10. The MCHC is expressed in mass fractions and the MCV in fl. The inset represents simulations of the raw experimental data. The large plot represents the normalized data where each raw data was divided through by the area under the respective curves. The normalized plot amplifies the features of the curves to facilitate visual comparison.
