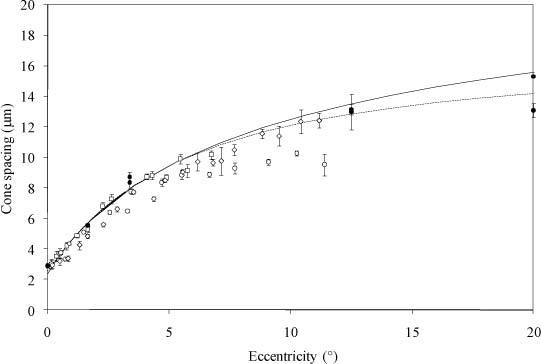
Fig. 2.

Cone spacing vs eccentricity: 1. Cone spacing computed from AOSLO images of 3 different healthy subjects (◇ nasal direction, □◯ inferior direction); 2. Cone spacing computed from published histological images (black solid circles) by Curcio et al. [35]; 3. Cone spacing in the temporal (solid line) and nasal (dotted line) directions inferred from density data reported by Curcio et al. [35].
