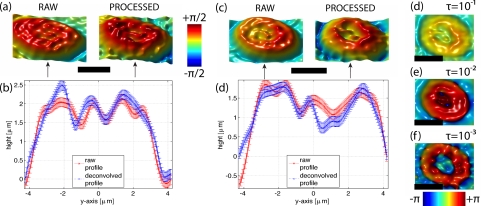
Fig. 7.
Human RBCs in phase. Images (a) and (c) show the phase images of two RBCs at θ = 0. Unprocessed images are labeled ’RAW’ and the label ’PROCESSED’ indicates the deconvolved phase for τ = 1. The profiles in (b) and (d) compare the according height differences of images above, at central sections (indicated by flashes). The error bars indicate the level of phase noise (≈ 0.1rad). Images (d)–(f) show the top view on RBC (c), processed with different τ (expressed in units of ). Colorbars, Scalebars: 4μm.

