
Fig. 3.
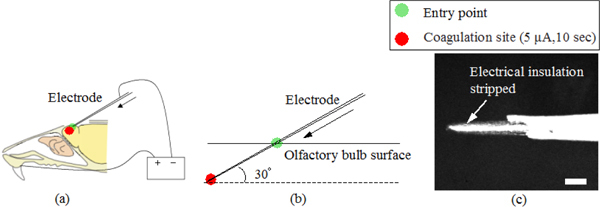
Schematic views describing (a) the electrocoagulation process and (b) a magnified view of the penetration of the electrode tip. (c) shows an optical micrograph of the magnified view of the insulation stripped tip region with the scale bar corresponding to 100μm.