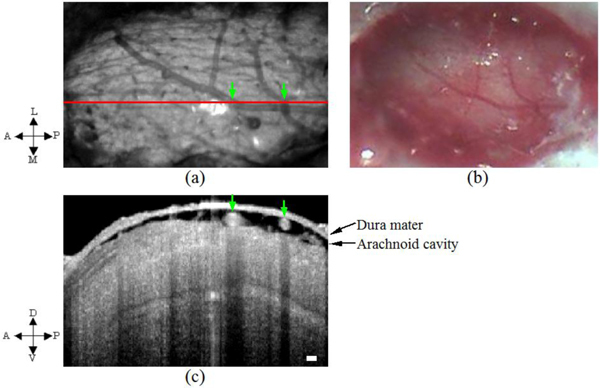
Fig. 4.

(a) OCT projection image (integration performed across the entire imaging depth, 2.9mm). (b) Corresponding CCD image. The red line in (a) indicates the scan position of the OCT image with the green arrows indicating the surface blood vessels and the corresponding shadows seen in (c) across the entire imaging depth. In the OCT images shown in this report, all depths were those measured in air and were not corrected of the refractive index of the medium. A, anterior; P, posterior; L, lateral; M, medial; D, dorsal; V, ventral. Scale bars, 100 μm.
