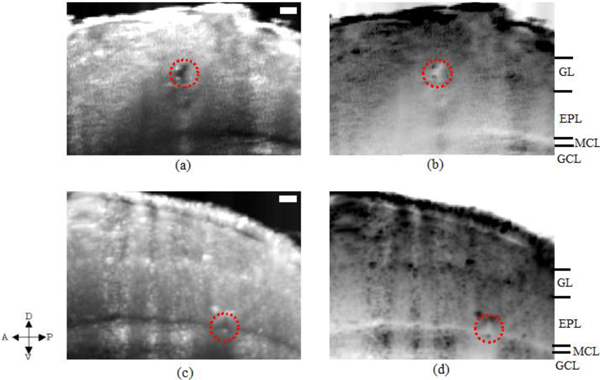
Fig. 6.

OCT images of OB obtained from two different electrocoagulation sites one in the GL layer while the other in the MCL layer. Red circled regions indicate the coagulation sites in both the real OCT backscattered intensity map (a) and (c). The same results (a) and (c) are again shown for clarity as inverted intensity maps respectively in (b) and (d). Figures 5(d)–5(f) and Figs. 6(a) and 6(b) were obtained from the same rat OB but cross sectional planes were different. The arrows on the left corner indicate the anterior-posterior and dorsal-ventral parts of the rat. Scale bars, 100 μm.
