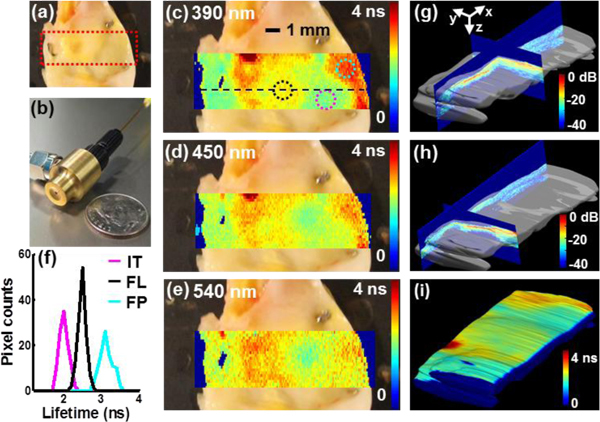
Fig. 1.

Representative co-registered FLIM and UBM measurements of a human carotid plaque sample. (a) Photo of the carotid plaque sample with the imaging area outlined by the red dashed line (12.2 mm x 4 mm). (b) The combined probe integrating an ultrasonic transducer and an optical fiber. (c)-(e) FLIM images overlaid on top of the plaque photo at three different wavelengths, where the color represented average lifetime values from 0 ns to 4 ns for each pixel. Three regions were labeled in (c) and analyzed (f) Histogram of the average lifetime values at 390 nm from the three regions in (c) corresponding to three tissue types (IT: intimal thickening, FL: fibro-lipidic plaque, and FP: fibrotic plaque). (g)-(h) 3D UBM volume data from the investigated region (12.2 x 4 x 2 mm3). Surface renderings of the UBM volume with orthogonal planes are shown with 45 dB displaying dynamics range and jet color map. (i) FLIM map at 390 nm coregistered with and overlaid onto a 3D UBM volume rendering. The minor differences in color scale between (c) and (i) are a by-product of 3D rendering. The PAI data can be displayed similarly but is not shown here to simplify the figure.
