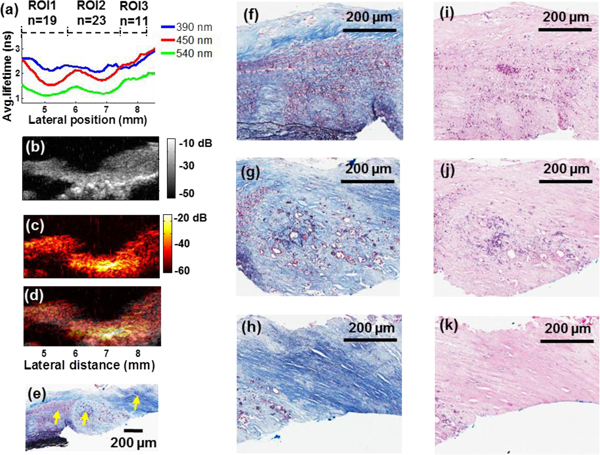
Fig. 3.

Example of the multimodal measurements from a different scanning location of the carotid plaque sample and data correlation. (a) Plots of the average lifetime as a function of scanning position. Three ROIs were analyzed to show the changes in surface composition. (b) Transverse UBM images from the same position as (a) showed the reconstruction of the plaque structure, where an acoustic shadowing area indicated calcific deposits. (c) The PAI image provided optical absorption contrast. (d) Co-registered UBM and PAI images were fused as one combined image. (e) The corresponding trichrome stained tissue section. (f)-(k) Zoomed-in histological images of the regions labeled with arrows in (e): (f) and (i) inflammation\macrophages, (g) fibrotic-calcific region using the trichrome stain, (j) H&E staining confirming the presence of calcification, (h) and (k) fibrotic plaque, respectively
