
Fig. 2.
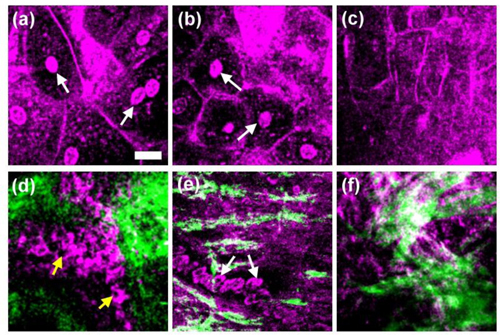
Harmonic generation images of normal oral mucosa tissue in one healthy human subject. The horizontal section images are serial sections beginning at the top surface of the mucosa and progressing deeper into the tissue. The purple color represents THG signals and the green color indicates SHG signals. (a) The superficial epithelial cell layer at a depth of 25 μm; (b) the deeper superficial epithelial cell layer at a depth of 40 μm; (c) the intermediate epithelial cell layer at a depth of 90 μm; (d) the basal cell layer and the adjacent collagen fibers at a depth of 190 μm; (e) the collagen fibers and the erythrocytes (arrowheads) in the lamina propria with blood flow at a depth of 220 μm; (f) collagen fibers in the deeper lamina propria at a depth of 250 μm. (Scale bar: 20 μm).