
Fig. 3.
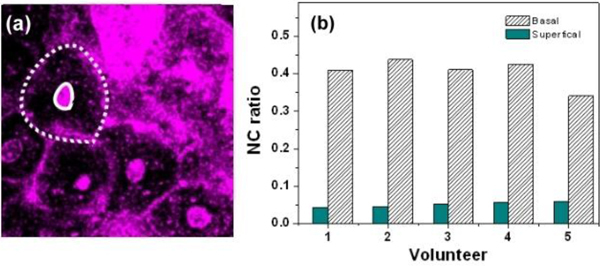
(a) Sample THG image for NC ratio analysis. The areas of cells and nuclei were defined with dashed and solid lines, respectively. (b) The nucleus-cytoplasmic (NC) ratio in the superficial and the basal cell layers from five volunteers. The average values of thus analyzed NC ratios in the superficial and basal cell layers for five volunteers are 0.051 ± 0.006 and 0.392 ± 0.045, respectively.