
Fig. 4.
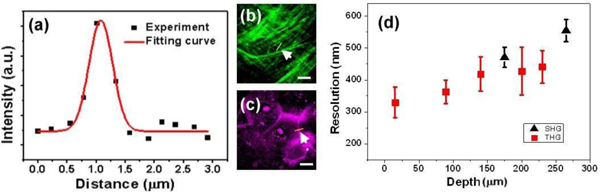
The lateral resolution of HGM images in human oral mucosa. (a) The spatial intensity distribution of SHG or THG was fitted by a Gaussian curve. We analyzed the resolutions of SHG and THG images by using (b) collagen fibers (arrowhead) for SHG and (c) cell membranes (arrowhead) for THG. (d) THG (solid squares) and SHG (solid triangles) lateral resolution versus depth in epithelium and lamina propria are summarized. (Scale bar: 20 μm)