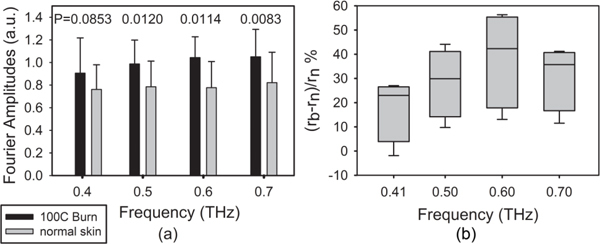
Fig. 3.

(a) Histogram of the average and standard deviation of the reflection spectral amplitudes from normal and burned skin at four frequency points. The observed contrast is statistically significant (p < 0.05) at 0.5, 0.6, and 0.7 THz. (b) The whisker plot represents the normalized difference between terahertz reflectivity of burned and normal skin.
