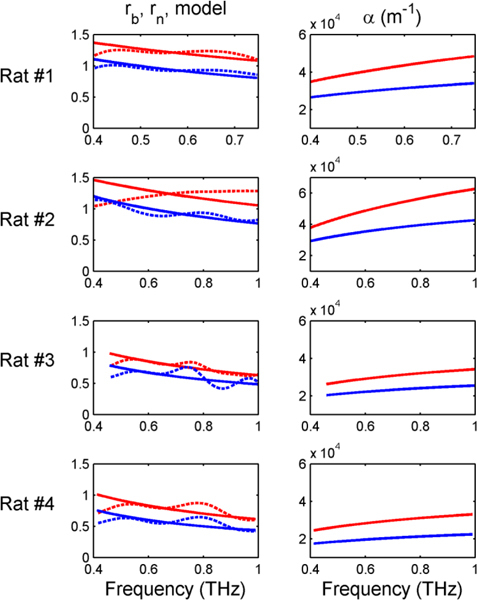
Fig. 4.

Left column panels plot the Fourier amplitudes of the experimental terahertz reflectivity of normal (dotted blue lines) and burned tissue (dotted red lines). The solid lines show the double Debye model fits. Right column shows the calculated absorption coefficient for each burned and normal sample from the model parameters.
