Fig. 5.

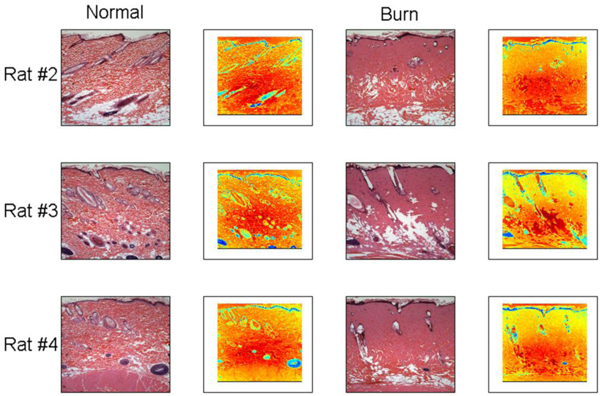
Histological section images of normal (control experiment) and 100○C, 30 second burn injuries are shown along with their respective outputs of the image processing routine.

Histological section images of normal (control experiment) and 100○C, 30 second burn injuries are shown along with their respective outputs of the image processing routine.