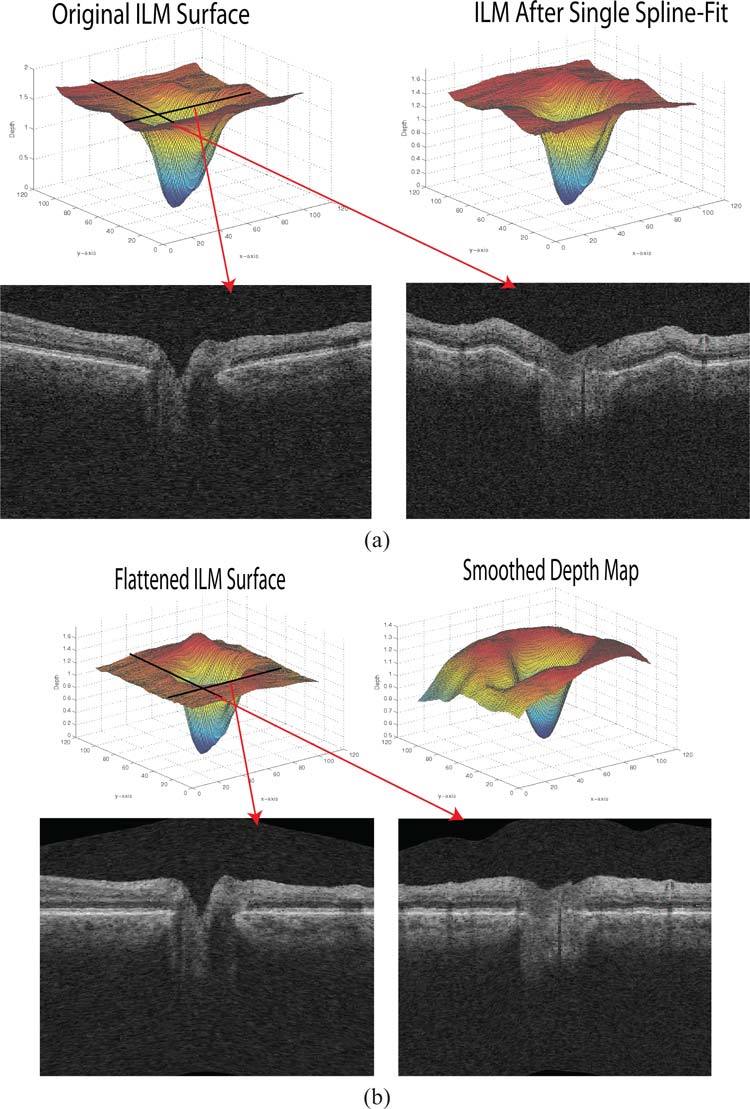
Fig. 9.

An ONH-centered dataset before and after the axial artifact correction. (a) The ILM in the original dataset and after the first spline fit. Bf-scan and Bs-scan from the original dataset from the locations as indicated by arrows in red. (b) The ILM in the flattened artifact corrected dataset with the same Bf-scan and Bs-scans from the flattened dataset. Smoothed depth image also included.
