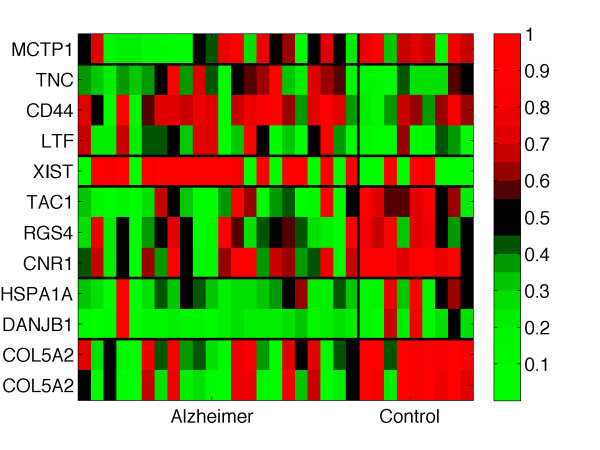
Figure 3.
Heatmap for the GSE1297 signature. Heatmap representing the gene expression of the 12 selected probestes by l1l2FS in the GSE1297 experiment. The thick black lines show the gene groups identified with the k-means clustering technique. The samples are divided in two classes: AD and control. The red and green colors represent high and low expression respectively. For visualization purposes the expressions have been scaled between 0 and 1.

