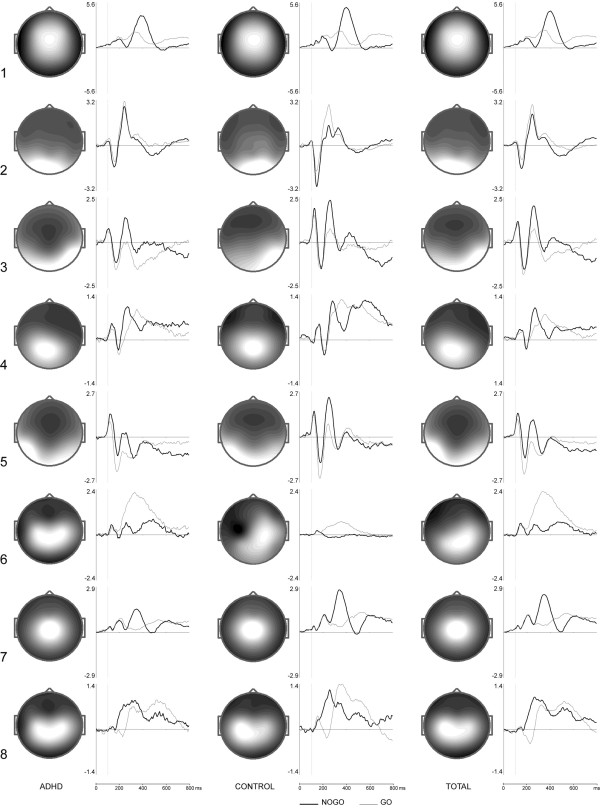
Figure 3.
Topographies and activation curves of go/nogo condition independent components. ICA was performed on ERPs of the ADHD group (left), on ERPs of the control group (middle) and on ERPs of the total group (right), for a time interval after the onset of the second stimuli in the go (thin line) and nogo (thick line) conditions. × axis is time in ms, y axis is amplitude in standard units.

