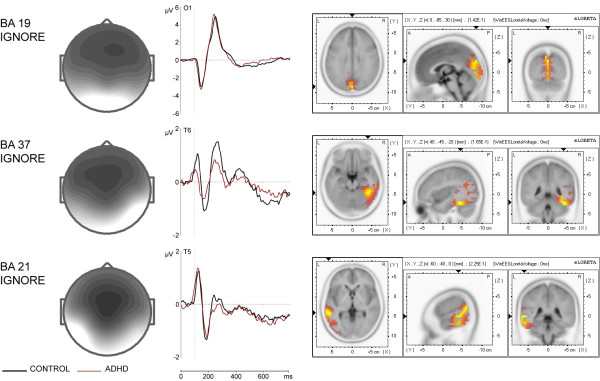
Figure 5.
Topographies and time courses of the preparatory-set-independent components. Time courses are based on spatial filtration and are depicted separately for control (black line) and ADHD (red line) group. × axis is time in ms, y axis is amplitude in μV. sLORETA imaging of total group is presented on the right.

