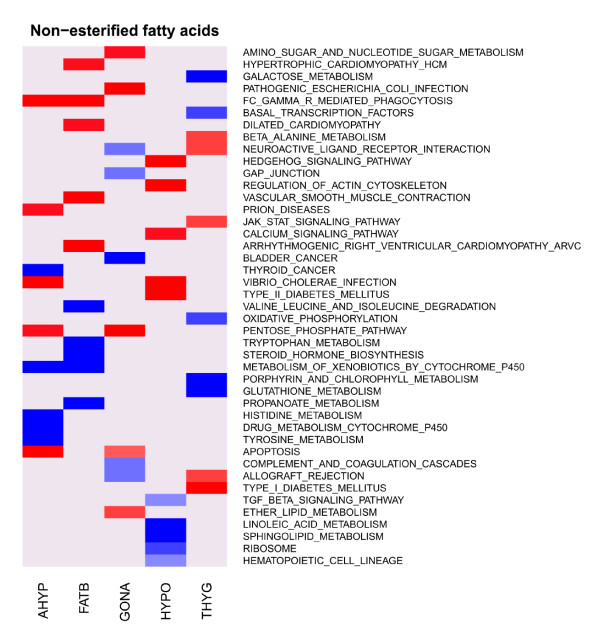
Figure 2.
Heat map of KEGG pathways enrichment scores for non-esterified fatty acids in five tissues. Red (blue) denotes top five pathways with positive (negative) normalized enrichment scores in gene set enrichment analysis (GSEA) for backfat (FATB), gonad (GONA), adenohypophysis (AHYP), thyroid (THYG), hypothalamus (HYPO).

