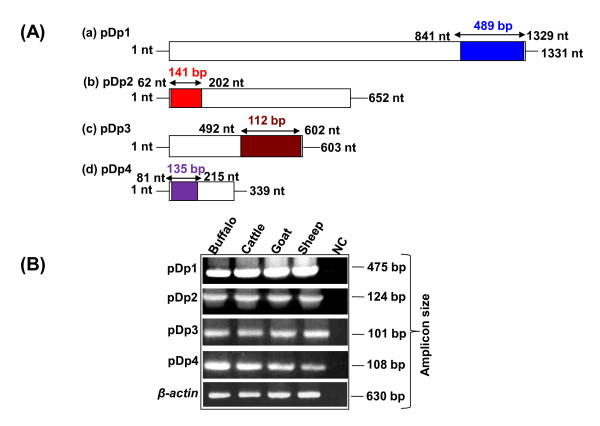
Figure 3.
PCR amplification of bovine genomic DNA using internal primers designed from the ORF of buffalo RsaI sequences. Schematic representation (A) shows PCR strategy used for amplification of ORF regions of RsaI sequences corresponding to 489, 141, 112 and 135 bp, respectively (a-d). Panel (B) shows PCR amplification of RsaI ORF regions and β-actin as control. The corresponding position of each PCR product is shown in Panel (A). Sequence IDs are indicated on left, amplicons size on right and species are mentioned on top of the lanes.

