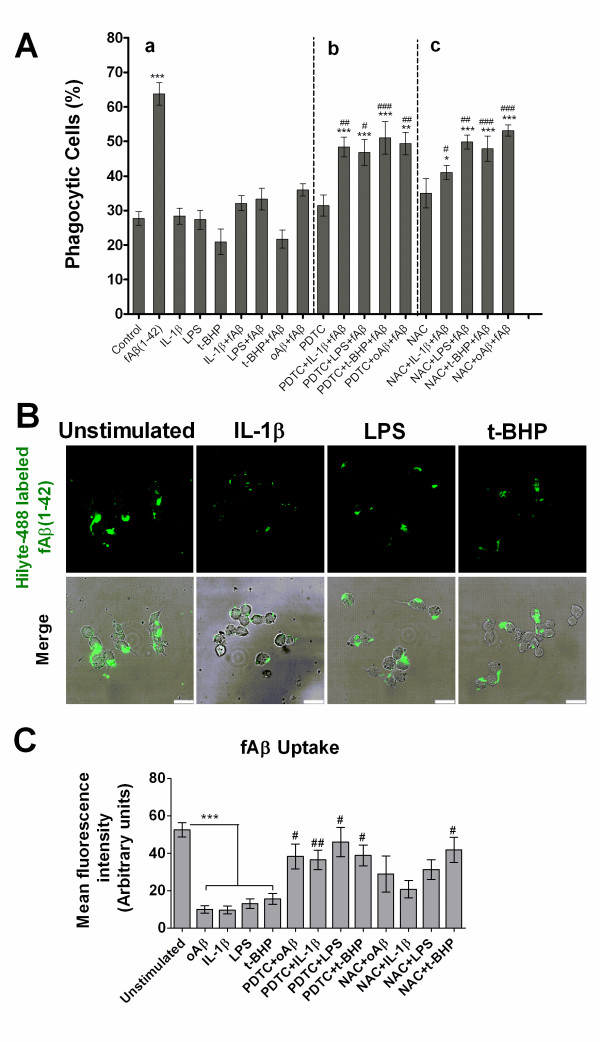
Figure 7.
Effects of IL-1β, LPS and t-BHP on the phagocytic response of microglial cells: regulation of PDTC and NAC. BV-2 cells were pretreated with PDTC (20 μM) or NAC (5.0 mM) alone or with IL-1β (20 ng/ml) for 18 h or LPS (1.0 μg/ml) and oAβ(1-42) (1.0 μM) for 12 h or t-BHP (100 μM) for 1 h. On the day of phagocytosis assay, the cells were treated with fAβ(1-42) (5.0 μM) for 30 min and incubated with fluorescent microspheres for another 30 min (A) or incubated alone with Hilyte-488 labeled fAβ(1-42) (5.0 μM) (B-C). Phagocytosis of the microspheres was quantified as percent of phagocytic cells. (B) Confocal images of microglial cells ingesting green Hilyte-488 labeled fAβ. Overlays of phase-contrast and confocal images were also shown in D right. Scale bars = 25 μm. (C) Quantification of internalized fluorescent fAβ per cell. Values were expressed as mean fluorescence intensity (arbitrary units). Data are expressed as mean ± S.E. from the three independent experiments. *P < 0.05, **P < 0.01 or ***P < 0.001 compared with the unstimulated control; #P < 0.05,##P < 0.01 compared with the drug (PDTC or NAC)-free group.

