Figure 4.

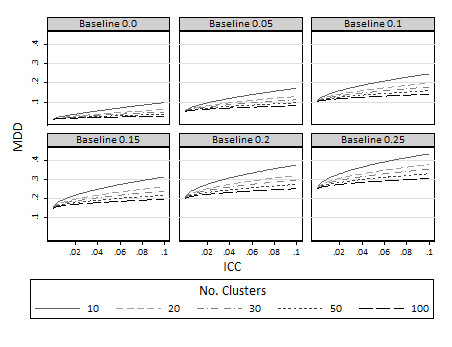
Minimum detectable difference (π2) at 80% power various different baseline proportions (π1): limiting values as the cluster size approaches infinity.

Minimum detectable difference (π2) at 80% power various different baseline proportions (π1): limiting values as the cluster size approaches infinity.