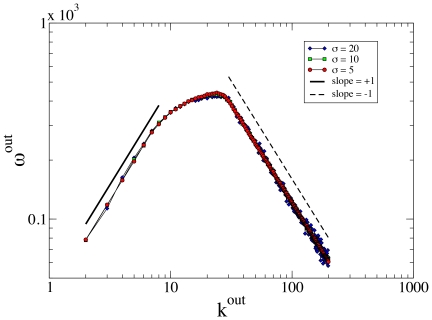
Figure 4. Results for the single user and different values of σ, the inter-user queue size variance.
We fixed the average queue size at qmax,i = 50 and extracted the priorities of user neighbors from a power-law statistical distribution with exponent γ = −2.1. For each ki we run T = 500 time steps and present the medians among 103 runs.

