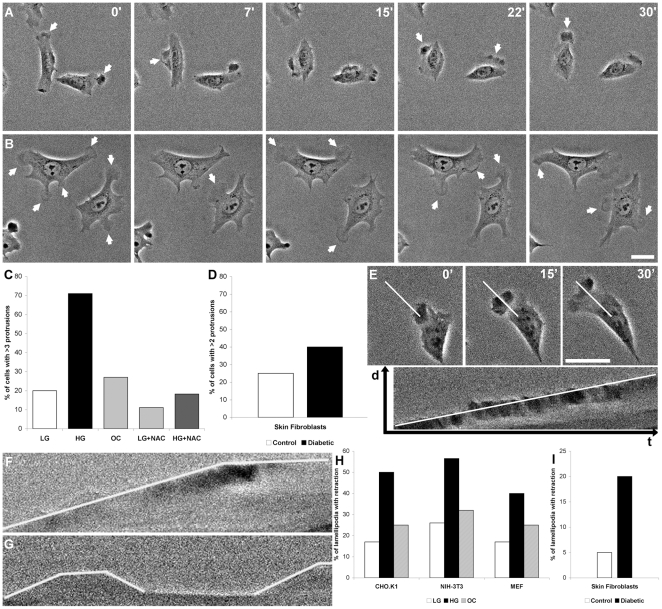
Figure 2. Cells cultured with high glucose show an increased number of short-lived protrusions.
Photomicrographs show changes in CHO.K1 cell protrusions (arrows) within 7, 15, 22 and 30 minutes in cells cultured under control (A) and high glucose (B) conditions. C: Shows the percentage of CHO.K1 cells with more than 3 protrusions over a 30 minutes period in low glucose (LG), high glucose (HG) or osmotic control (OC) medium and in the presence or absence of the antioxidant N-acetylcysteine (NAC, 10 mM) for 1 hour. D: Shows the percentage of primary skin fibroblasts of control and diabetic rats with more than 2 protrusions over a 30 minutes period. E: Kymograph showing the extension of a protrusion over time. F: Kymographs of LG and (G) HG treated CHO.K1 cells, showing that protrusions under high glucose treatment are less stable and retract, followed by the formation of new protrusions at the same places. H: shows the percentage of lamellipodia that retract over a 30 min period in CHO.K1, NIH-3T3 and MEF cells and (I) shows the same for primary skin fibroblasts from control and diabetic rats. Bar: 10 µm.

