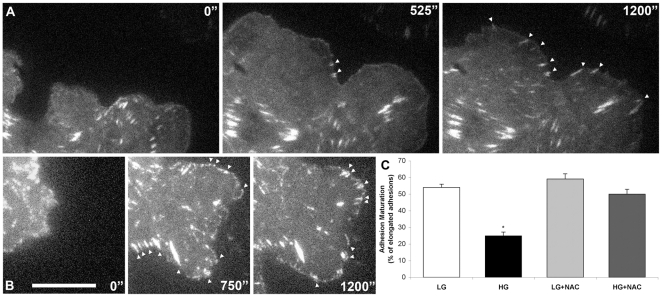
Figure 3. High glucose negatively affects adhesion maturation in CHO.K1 cells.
After 2 days treatment, cells were transfected with GFP-paxillin and their adhesion dynamics analyzed 24 h later using TIRF microscopy. The increase in adhesion size and fluorescence intensity were considered signs of maturation (arrows). Time-lapse sequences show adhesions maturation of (A) high glucose (HG) and (B) Low glucose (LG) treated cells. C: The graph shows the probability of adhesion maturation of LG or HG treated cells, in the presence or absence of 10 mM N-acetylcysteine (NAC) for 1 hour, using at least 10 cells for each condition. Bar: 5 µm. (*) P≤0.01.

