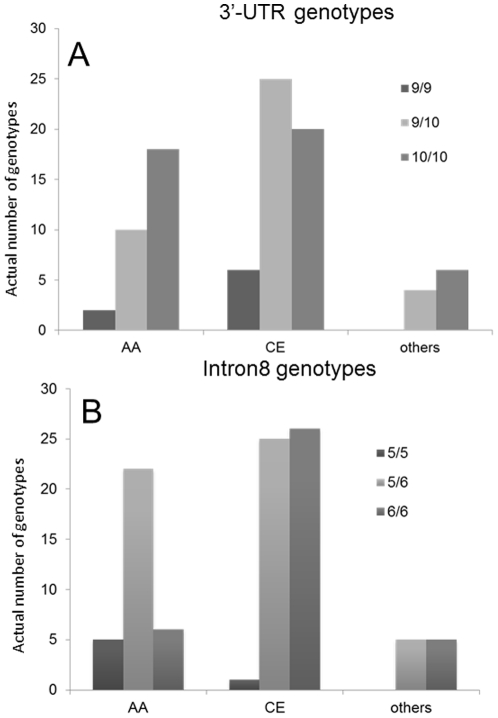
Figure 2. Genotype distribution in AA and CE populations.
The height of the bars representing 3′-UTR genotypes (A) and intron8 genotypes (B) corresponds to occurrence of each genotype category (actual number of individuals) in groups comprising African-Americans (AA), Caucasians (CE) and other ethnicity (others).

