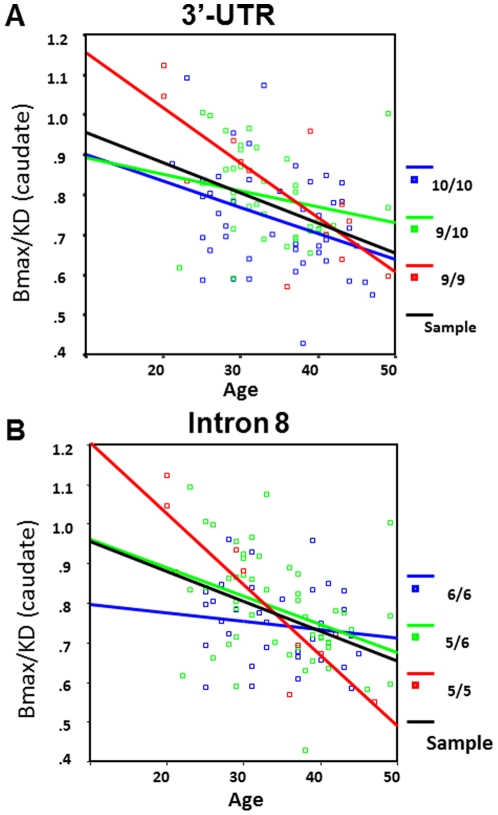
Figure 4. Age-related changes in the DAT binding potential.
Scatterplots show the regression between the measures of DAT availability in striatum (Y-axis) and age (X-axis) in 3′-UTR- (A) and intron8-(B) genotype-based groups. Black regression line – all subjects of the sample, colored lines – genotype-based subgroups.

